What a spirometry graph actually represents in pulmonary testing
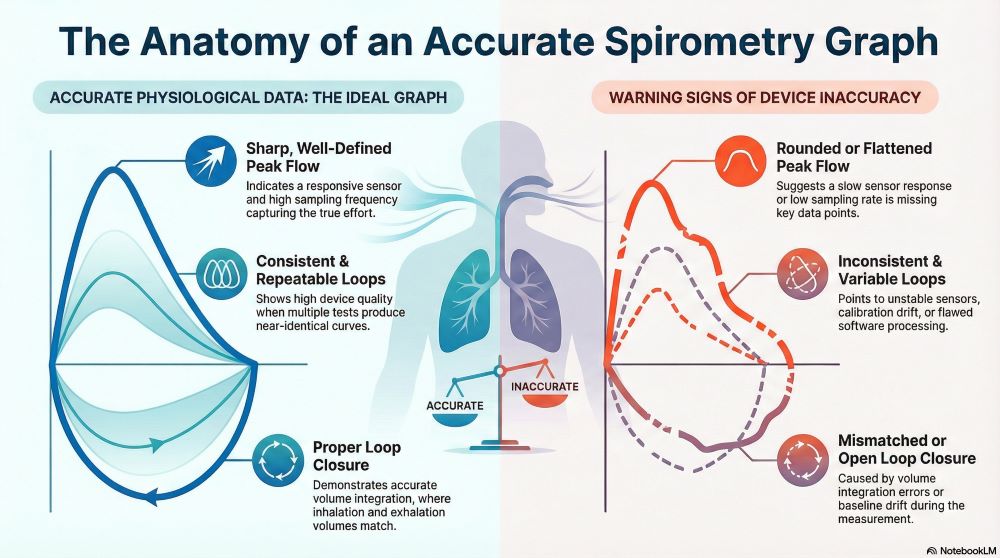
A spirometry graph is a visual representation of airflow and lung volume relationships during forced breathing maneuvers. It translates raw sensor measurements into interpretable curves that reflect how efficiently air moves through the respiratory system. The shape, scale, and continuity of the graph directly depend on device calibration, sensor responsiveness, and signal processing accuracy.
Clinicians rely on spirometry graphs to distinguish between normal pulmonary function and obstructive or restrictive patterns. Any distortion, delay, or inconsistency in data capture alters the graph’s clinical meaning. As a result, the spirometry graph functions as both a diagnostic output and an indirect indicator of device performance.
How flow-volume loop spirometry visualizes airflow dynamics
Flow-volume loop spirometry plots airflow on the vertical axis against lung volume on the horizontal axis during forced inhalation and exhalation. This format compresses complex respiratory mechanics into a single continuous loop. The expiratory curve reflects airway resistance and patient effort, while the inspiratory limb highlights upper airway function and measurement symmetry.
Because airflow changes rapidly during forced maneuvers, flow-volume loops demand high temporal resolution from spirometry systems. Devices that under-sample airflow or smooth signals excessively produce flattened peaks and rounded transitions. Accurate flow-volume loops therefore require precise flow sensors and real-time data acquisition.
Why spirometry graph accuracy depends on sensor response time
Spirometry accuracy begins at the sensor level, where airflow must be detected, converted, and transmitted without lag. Rapid changes in flow occur within milliseconds, particularly at peak expiratory flow. Sensors with slow response times miss these transitions, leading to underreported peaks and distorted curves.
In a spirometry graph, delayed sensor response appears as blunted slopes or shortened loop height. These distortions are not random; they consistently bias results toward lower airflow values. For performance evaluation, the sharpness and symmetry of the flow-volume loop provide immediate insight into sensor responsiveness.
What a labeled spirometry graph reveals about measurement integrity
A spirometry graph labeled with axes, units, and reference points allows clinicians to evaluate both patient performance and device behavior. Proper labeling clarifies whether volumes are plotted in liters and airflow in liters per second, ensuring correct interpretation. Inconsistent or ambiguous labeling increases the risk of clinical misjudgment.
A labeled spirometry graph also makes device limitations more visible. Irregular axis scaling, truncated volume ranges, or compressed flow values suggest internal software constraints rather than physiological findings. Clear labeling therefore supports transparency and reinforces confidence in spirometry data quality.
How flow-volume loop shape reflects calibration precision
Calibration aligns sensor output with known airflow and volume standards. When calibration drifts, flow-volume loop spirometry exhibits predictable shape changes. Peak flows may shift downward, loop width may narrow, and the expiratory limb may lose its characteristic contour.
Well-calibrated systems generate loops with consistent proportions across repeated tests. Variability beyond patient effort typically indicates calibration error or environmental interference. Reviewing loop symmetry and repeatability is one of the fastest ways to assess whether a spirometry device remains within acceptable performance parameters.
The role of volume integration in spirometry graph accuracy
Volume in spirometry graphs is calculated by integrating airflow over time. Any error in flow measurement compounds as volume accumulates, magnifying small inaccuracies into clinically significant deviations. This integration process makes volume curves especially sensitive to baseline drift and signal noise.
In flow-volume loops, integration errors appear as uneven loop closure or mismatched inspiratory and expiratory volumes. Accurate devices maintain stable baselines and consistent integration algorithms, ensuring that loop endpoints align correctly. Volume integrity is therefore inseparable from flow measurement quality.
Why sampling frequency affects flow-volume loop fidelity
Sampling frequency determines how often airflow data is captured during a breathing maneuver. Low sampling rates smooth over rapid changes, while higher rates preserve sharp transitions. Flow-volume loop spirometry depends on high-frequency sampling to accurately capture peak expiratory flow and early exhalation dynamics.
Insufficient sampling produces rounded peaks and delayed curve inflections. These artifacts reduce diagnostic sensitivity, particularly in early airway obstruction. Devices designed for clinical-grade spirometry prioritize sampling frequency to preserve the true shape of the respiratory loop.
How software algorithms influence spirometry graph appearance
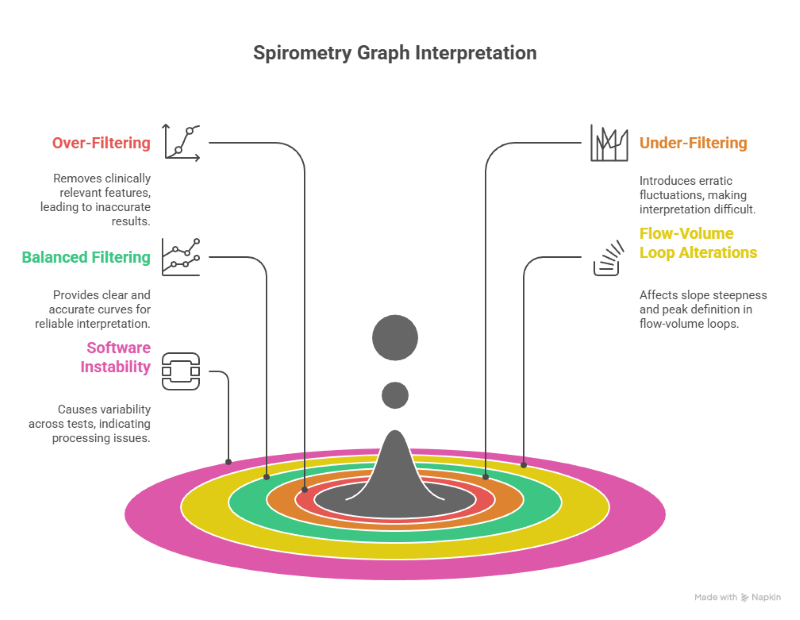
Raw sensor data is processed through algorithms that filter noise, correct drift, and generate curves. Over-aggressive filtering can remove clinically relevant features, while under-filtering introduces erratic fluctuations. The balance between clarity and fidelity directly affects spirometry graph interpretation.
In flow-volume loops, algorithmic smoothing alters slope steepness and peak definition. Consistent, reproducible curves suggest well-tuned processing, while variability across tests points to software instability. Graph appearance is therefore as much a software outcome as a hardware one.
Distinguishing patient effort from device limitation in spirometry graphs
Spirometry depends on patient cooperation, but device limitations can mimic poor effort. Reduced peak flow, shortened expiratory time, or irregular loop shapes may reflect sensor lag rather than suboptimal performance. Separating these factors is critical for accurate interpretation.
Repeated testing provides clarity when device accuracy is high. Consistent abnormalities across well-coached attempts suggest physiological limitation, while inconsistent curves indicate measurement issues. Reliable spirometry systems minimize ambiguity by producing stable, repeatable graphs under similar conditions.
How environmental factors alter flow-volume loop spirometry
Temperature, humidity, and barometric pressure affect airflow density and sensor behavior. Modern spirometry systems compensate for these variables automatically, but compensation accuracy varies by device. Uncorrected environmental influence subtly distorts spirometry graphs.
Flow-volume loops affected by environmental drift often show gradual baseline shifts rather than abrupt anomalies. Accurate devices integrate environmental correction seamlessly, preserving loop shape consistency across testing environments. Environmental resilience is a core component of spirometry performance.
What repeatability in spirometry graphs indicates about device quality
Repeatability reflects a device’s ability to produce consistent results under identical conditions. In spirometry, repeatability is evaluated by overlaying multiple flow-volume loops from the same session. High-quality devices generate near-identical curves with minimal divergence.
Poor repeatability signals unstable sensors, inconsistent sampling, or flawed processing algorithms. When spirometry graphs vary widely without physiological explanation, device accuracy becomes questionable. Repeatability is therefore a practical benchmark for evaluating spirometry system reliability.
Why flow-volume loops are central to clinical interpretation
Flow-volume loops provide more diagnostic context than volume-time curves alone. They reveal airflow limitation patterns, airway collapse, and inspiratory abnormalities within a single visualization. This richness makes loop accuracy essential for meaningful clinical use.
Any distortion reduces interpretive value and increases diagnostic uncertainty. Accurate flow-volume loop spirometry preserves subtle features that guide clinical judgment. Device performance directly determines whether these features remain visible and trustworthy.
How spirometry systems translate raw data into clinical decisions
Spirometry systems serve as intermediaries between physiological events and clinical conclusions. The spirometry graph is the primary medium through which this translation occurs. Errors introduced at any stage propagate into interpretation and decision-making.
High-performing devices prioritize data integrity from sensor to display. This approach ensures that clinicians evaluate true respiratory behavior rather than artifacts. Reliable spirometry graphs support confident, evidence-based respiratory assessment.
Evaluating spirometry device accuracy through graphical analysis
Graphical analysis offers immediate insight into spirometry device performance without specialized tools. Clinicians can assess curve smoothness, peak definition, loop closure, and repeatability visually. These features collectively indicate measurement quality.
Flow-volume loop spirometry excels in this role because it compresses multiple performance indicators into a single graph. Accurate devices consistently produce physiologically plausible, reproducible loops. Visual evaluation remains a practical and effective performance check.
How to interpret spirometry graph patterns with clinical precision
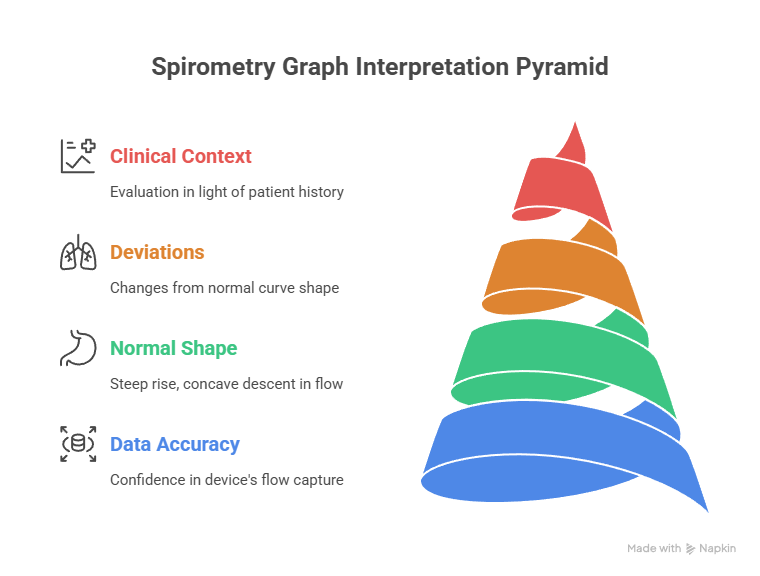
Spirometry graph interpretation depends on recognizing consistent shape patterns rather than isolated numeric values. The overall contour of the curve communicates airflow limitation, volume restriction, or mixed dysfunction. Accurate interpretation assumes the device faithfully captured rapid flow changes without distortion.
Normal spirometry graphs show a steep initial rise in expiratory flow followed by a smooth, concave descent. Deviations from this shape must be evaluated in the context of device performance before clinical conclusions are drawn. Graph interpretation always begins with confidence in data accuracy.
What normal versus abnormal flow-volume loops reveal
Normal flow-volume loop spirometry produces a symmetric, well-defined loop with predictable proportions. Peak expiratory flow occurs early, and inspiratory flow mirrors expiratory volume without interruption. This pattern reflects unobstructed airflow and stable measurement conditions.
Abnormal loops display flattening, truncation, or irregular curvature. These changes may indicate obstruction, restriction, or extrathoracic airflow limitation. When abnormalities appear inconsistently across trials, device accuracy becomes the primary variable to evaluate.
How obstructive patterns appear on a spirometry graph
Obstructive disease patterns produce a characteristic scooped or concave expiratory limb on the spirometry graph. Peak flow is reduced, and airflow declines more rapidly than expected as volume decreases. These features are only reliable when peak flow capture is accurate.
Devices that underestimate peak flow exaggerate obstructive appearance. Accurate spirometry systems preserve the sharp rise and early peak necessary to distinguish true obstruction from measurement artifact. Graph fidelity is essential for meaningful differentiation.
Restrictive patterns and their dependence on volume accuracy
Restrictive spirometry patterns show reduced loop width with relatively preserved shape. Total lung volume appears compressed, while peak flow may remain proportionate. These findings rely heavily on accurate volume integration.
Volume underestimation caused by baseline drift or integration error falsely suggests restriction. Reliable spirometry graphs ensure that reduced volume reflects physiology rather than cumulative measurement bias.
Why inspiratory limbs matter in flow-volume loop spirometry
The inspiratory limb is often overlooked, yet it provides critical information about upper airway function and measurement symmetry. Smooth, consistent inspiratory curves indicate stable sensor performance across bidirectional flow. Disruptions raise concern for either airway limitation or device inconsistency.
Inspiratory flattening that appears intermittently often reflects flow measurement instability. Accurate devices maintain inspiratory curve integrity across repeated maneuvers. Balanced loop symmetry supports both diagnostic clarity and confidence in device performance.
How spirometry graph artifacts can mimic pathology
Artifacts arise from coughing, hesitation, leaks, or sensor instability. These artifacts introduce abrupt spikes, notches, or discontinuities in the spirometry graph. Distinguishing artifact from pathology depends on reproducibility and curve coherence.
Device-related artifacts tend to repeat in similar positions across tests. Patient-related artifacts vary unpredictably. High-quality spirometry systems minimize internal artifacts, making true physiological patterns easier to identify.
The importance of early expiratory flow accuracy
Early expiratory flow contains the most diagnostically significant information in spirometry. Peak expiratory flow and early slope shape define obstructive severity and airway responsiveness. Any delay or smoothing in this region reduces clinical sensitivity.
Flow-volume loop spirometry highlights early flow behavior clearly when device response is sufficient. Systems that preserve early peak definition provide more reliable assessment of airway function.
How spirometry graphs support longitudinal monitoring
Long-term respiratory monitoring relies on comparing spirometry graphs across time. Subtle changes in loop shape may indicate progression or improvement before numeric thresholds shift. Consistent device accuracy is required for valid longitudinal comparison.
Inconsistent measurement characteristics undermine trend analysis. Stable spirometry systems produce graphs that remain comparable across months or years, supporting confident monitoring and clinical decision-making.
Evaluating spirometry system performance during routine use
Routine clinical use exposes spirometry systems to variability in users, environments, and patients. High-performing devices maintain graph integrity despite these variables. Performance evaluation often begins with visual inspection of the spirometry graph.
Clear peaks, smooth curves, and consistent loop closure suggest reliable operation. Visual degradation signals the need for calibration review or system assessment. Graph-based evaluation remains a practical quality-control approach.
Why spirometry graph clarity matters for clinical communication
Spirometry graphs are frequently shared across care teams and used to explain findings to patients. Clear, interpretable graphs reduce miscommunication and support shared clinical understanding. Ambiguous or distorted graphs introduce unnecessary uncertainty.
Devices that generate clean, labeled spirometry graphs facilitate accurate interpretation across settings. Graph clarity supports both diagnostic accuracy and effective clinical collaboration.
Why BOMImed emphasizes precision in spirometry system selection
BOMImed focuses on spirometry systems that deliver consistent, high-fidelity graphical output across diverse clinical settings. Emphasis is placed on sensor responsiveness, stable calibration, and reliable software processing. These factors ensure that spirometry graphs accurately reflect patient physiology.
By prioritizing graphical integrity, BOMImed supports clinicians who rely on flow-volume loops for confident interpretation. Accurate spirometry graphs reduce uncertainty and improve the reliability of pulmonary assessments. Device performance is treated as foundational, not optional.
FAQ’s About Spirometry Graphs and Accuracy
What is a spirometry graph used for?
A spirometry graph visualizes airflow and lung volume during forced breathing to assess pulmonary function. It helps identify airflow limitation, restriction, and overall respiratory performance.
What does a flow-volume loop show in spirometry?
A flow-volume loop shows the relationship between airflow and lung volume during inhalation and exhalation. Its shape provides insight into airway resistance, obstruction, and measurement quality.
Why is a labeled spirometry graph important?
A labeled spirometry graph ensures correct interpretation by clearly defining axes, units, and scale. Proper labeling also helps identify device-related distortions or limitations.
Can spirometry graph errors come from the device itself?
Yes, sensor lag, calibration drift, low sampling frequency, and software processing issues can all distort spirometry graphs. These errors may mimic or obscure true physiological findings.
How can clinicians tell if a spirometry device is accurate?
Accuracy is suggested by sharp, reproducible flow-volume loops with consistent peak flows and proper loop closure. Visual repeatability across tests is a key indicator.
Do environmental conditions affect spirometry graphs?
Environmental factors such as temperature and humidity can influence airflow measurements. Accurate devices compensate for these variables to maintain graph consistency.
Why are flow-volume loops preferred over simple volume-time curves?
Flow-volume loops provide more detailed information about airflow dynamics and airway behavior. Their diagnostic value depends heavily on device accuracy and data fidelity.